October 15th 2024
From 2023 on into 2024 history is repeating itself. 2022 as we’ve seen was a year unique unto itself. After coming off the frenzied real estate market of covid with its multiple offers and enormous price hikes, 2022 was a year of corrections. The market declined steadily from a February peak of $863,057 right down to a December low of $656,337. A drop of $206,720. Quite a drop.
But then we got into a post covid rhythm of strong 6-month gains in the first half of the year followed by price slides in the second half. January to June in 2023 saw prices rise by $108,930 and then those gains were eroded by $92,424 at year end.
Well, as we referenced last month, once again this year the first 6 months saw substantial gains. The year 2023 ended with an average sale price across the region of $644,067. By June 2024 that average had grown to $744,110. A gain of $100,043. Pretty much in lock step with 2023.
And then came July and the inevitable price slide.
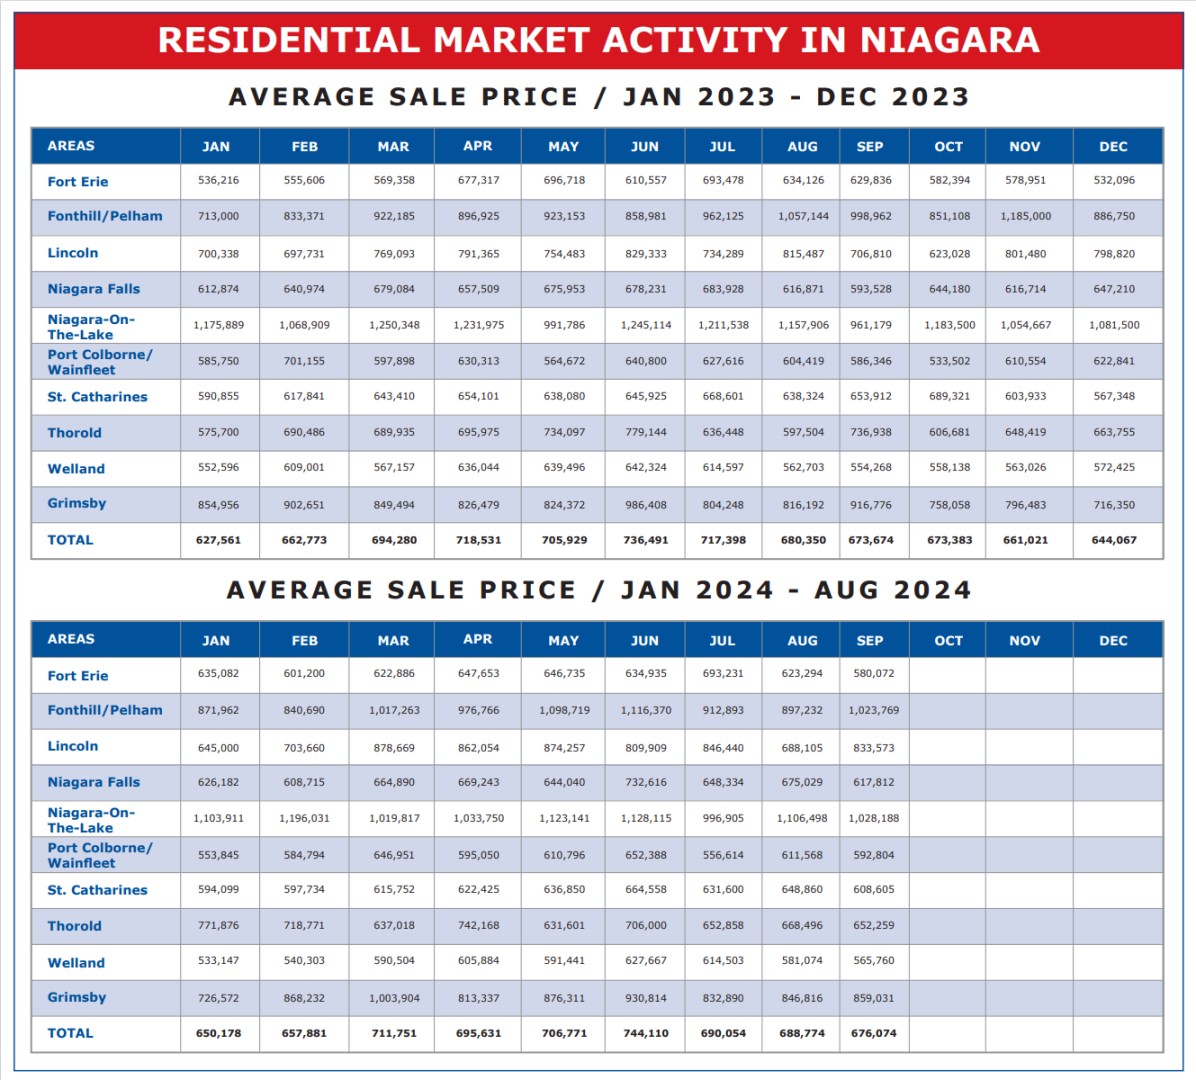
From June’s recorded high of $744,110, the average sale price in July had dropped to $690,054. A loss of $54,056 or 7.26%. Followed by August’s average of $688,774, a very modest drop of $1,280 or 0.19%. And now September’s average sale figure of $676,074 comes in down a further $12,700 or 1.84%.
So, in spite of some substantial gains made in the first 6 months of both 2023 and 2024, we are now here in September pretty much exactly where we were one year ago. September 2023 average $673,674 and September 2024 average $676,074. What is interesting however is that unlike last year, we have so far in 2024 seen 3 consecutive interest rate drops by the Bank of Canada, as well as an easing of the stress test for mortgage renewals. And yet, from the numbers it would seem that those rate cuts have had very little impact on the market when it comes to price.
And when we look at the results in September by individual municipality, we see that hardest hit areas are the ones with the largest populations and the greatest number of sales (not the small municipalities where one or two large sales can greatly skew the averages). St. Catharines saw average price in September drop by $40,255 or 6.20% and Niagara Falls by $57,217 or 8.48%. And so those numbers take into consideration a lot of transactions, and should be considered pretty reliable and indicative of what is going on.
Moving forward between now and the end of the year, while I don’t anticipate any upward movement in average sale prices, I don’t expect much movement downward either. Last year prices from September to year end slid by $29,607 or 4.39%. No real reason for it to be worse this year, and bear in mind we are enjoying decreasing costs of borrowing. That didn’t happen last year, and I expect it will continue downward between now and year end. At some point the public, now on the sidelines, are going to jump back in. If not this year, certainly by next spring.
And speaking of jumping back in, one other interesting statistic to consider is unit sales. They always taper off in the last half of the year. They did last year and they will again this year. But it seems this year things are going to continue to be strong for a little longer. In 2023 we saw total residential unit sales in August of 543. That number had dropped in September down to 393. This year August logged in across the region at 515 sales, but September remained strong at 512. A drop of only 3 units.
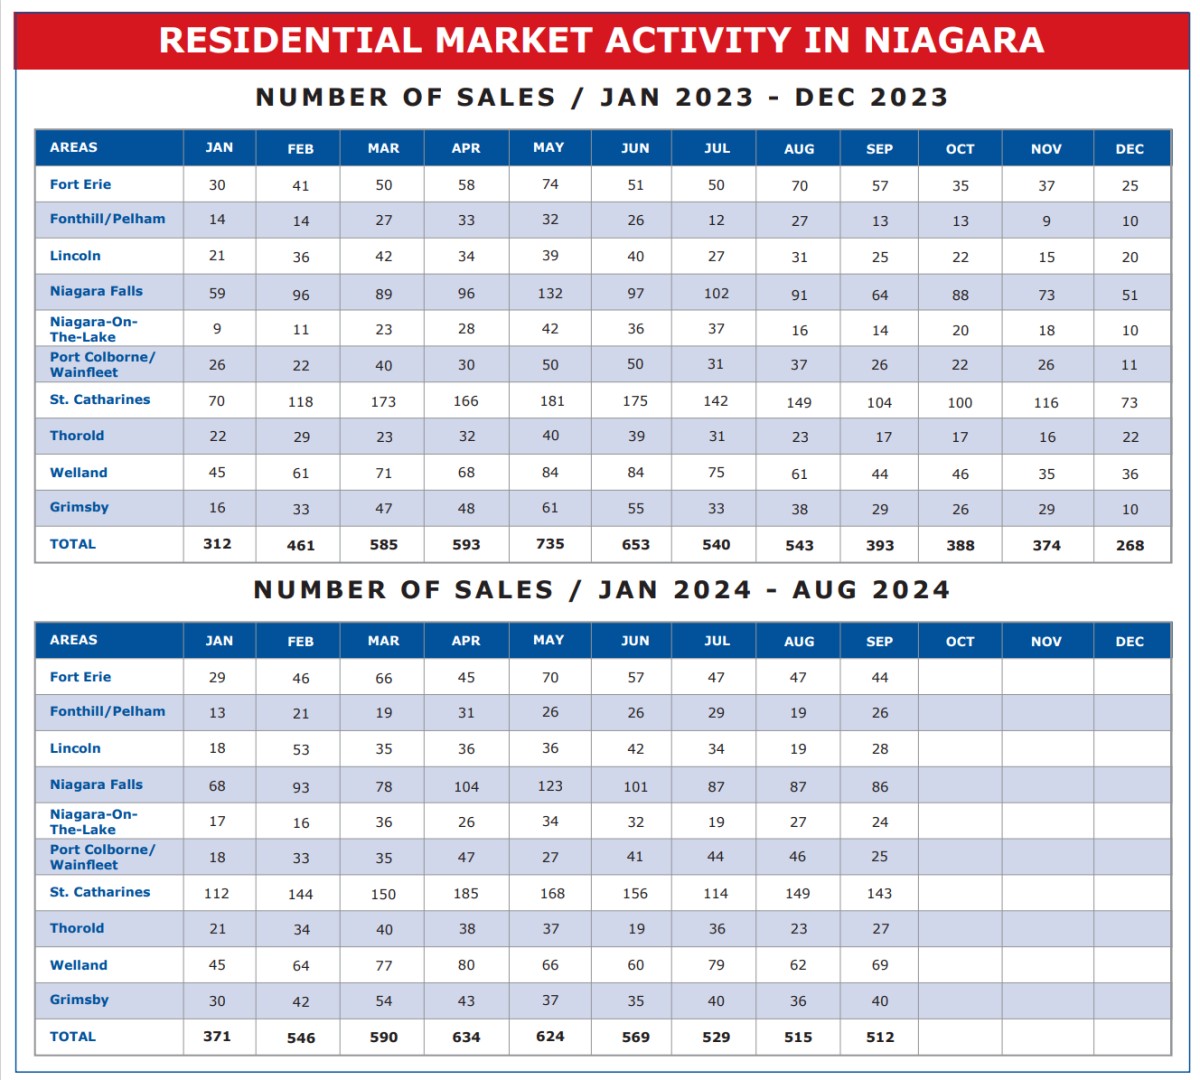
If you take a minute and do the math, you’ll see that in the first 9 months of 2024 a total of 4,890 residential unites changed hands, compared to 4,815 during the same period last year. An increase of only 75 units or 1.56%, but an upward trend none-the-less.
If you want to understand the real estate recovery post covid, think of a freight train. Tough to get moving. Slow to gain momentum. But it does get moving. It gains both speed and acceleration. That’s what we are starting to see. Slow, steady, but with the powerful booster of lower interest rates. Watch out when this thing really starts to move. It really is time to get into the market. Keep in mind the old adage – once you can see the bandwagon it’s usually too late to get on it.