April 15th 2025
Whether we are tracking unit sales or average sale price, there is a trend that seems to happen, year after year, provided no extreme external pressures are being applied. And that is up in the spring and down in the fall.
Now, when I say external pressures, I’m referring to things like COVID-19. That once-in-a-lifetime (hopefully) phenomenon really altered the normal flow of things.
But what about this year? A lot of external issues being faced within the marketplace. We are still adjusting from the roller coaster impact of COVID-19. But we are also in the midst of a federal election with all the uncertainty that brings. Then of course, we’ve got the sabre rattling from the south of us, with threats of tariffs and takeovers. On the one hand, we’ve got steadily lowering interest rates. On the other hand, we’ve got significantly reduced market values compared to the peak at the beginning of 2022, with people still licking their wounds. We are struggling our way out of the post-COVID-19 real estate recession, and we are feeling it in the marketplace. Unit sales are down. Down from last year. And certainly, down from the heady days of the Covid era. But in spite of everything, that spring trend is still continuing.
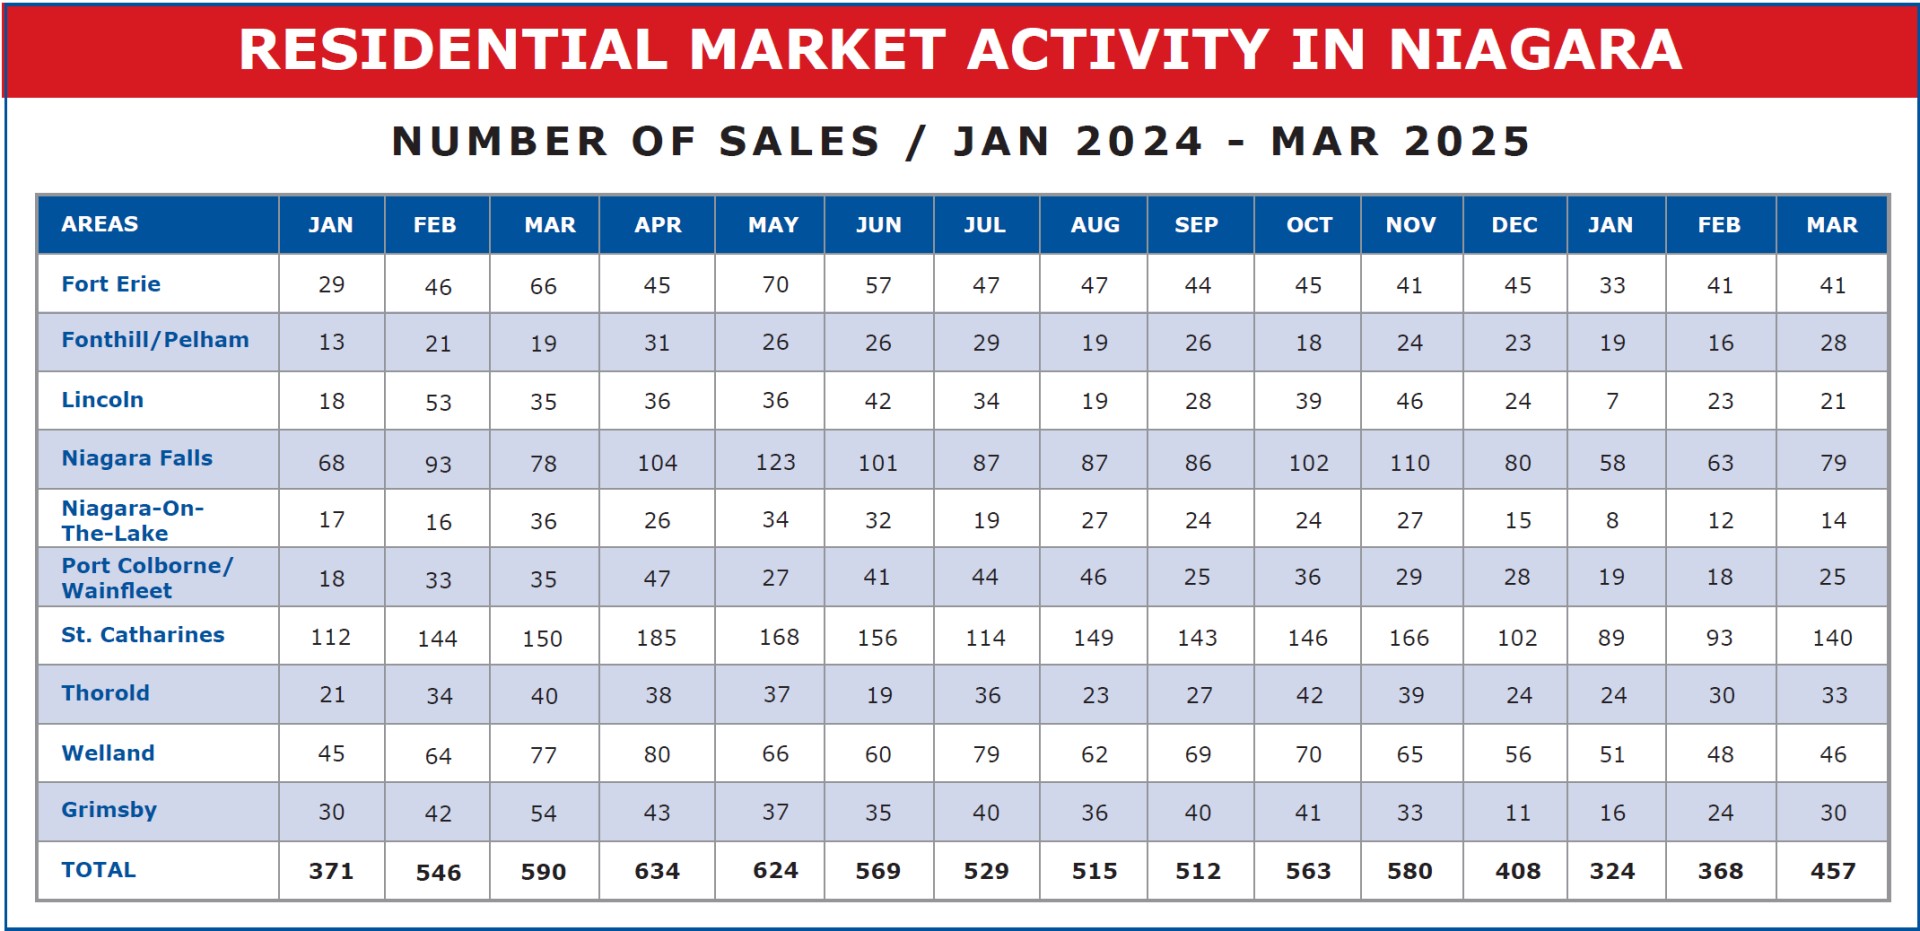
Let’s look at the unit sales. In March in the Niagara Board, we registered 457 units sold. That’s up 89 units or 24.2%, from February. And it’s up 133 units or 41.2% from January. At the same time, however, it is down 131 units or 22.2% from last March.
So, the trend is upward as we progress into the spring, but not to the extent we saw last year. Let’s look at the three-month trend and see how the last three years compare.
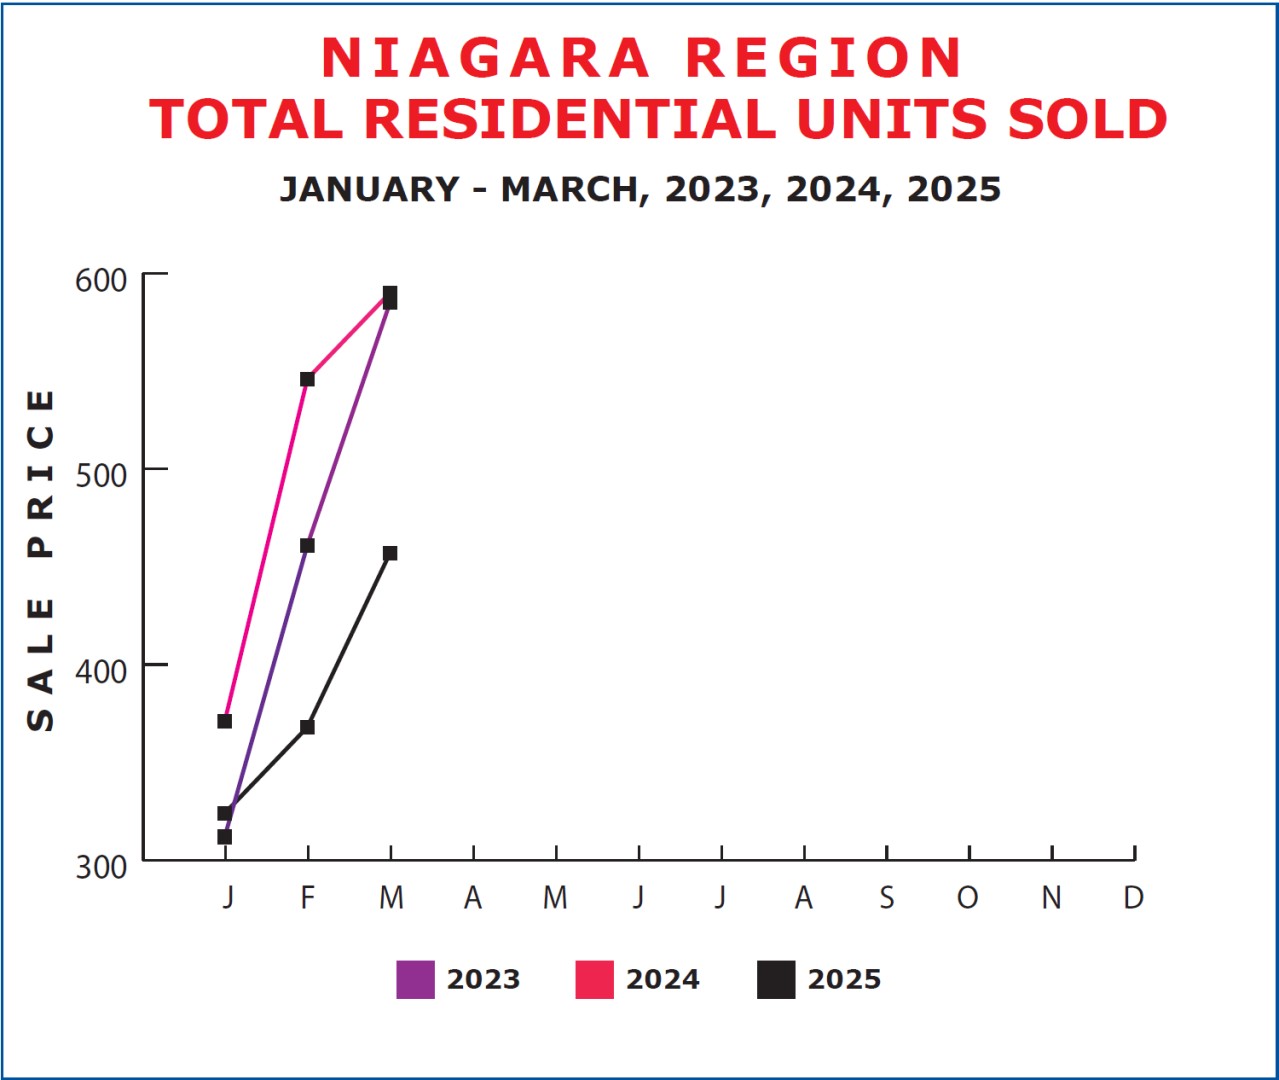
It will be interesting to watch what happens in the next couple of months. Typically, while March isn’t the most active month of the year, it isn’t far off it.
We saw a pretty significant jump in activity from February to March this year compared to last year. More like what we saw in 2023. Now the question is, will the activity continue to grow in the next few months? To see where the trend lies, let’s look at the hard numbers.
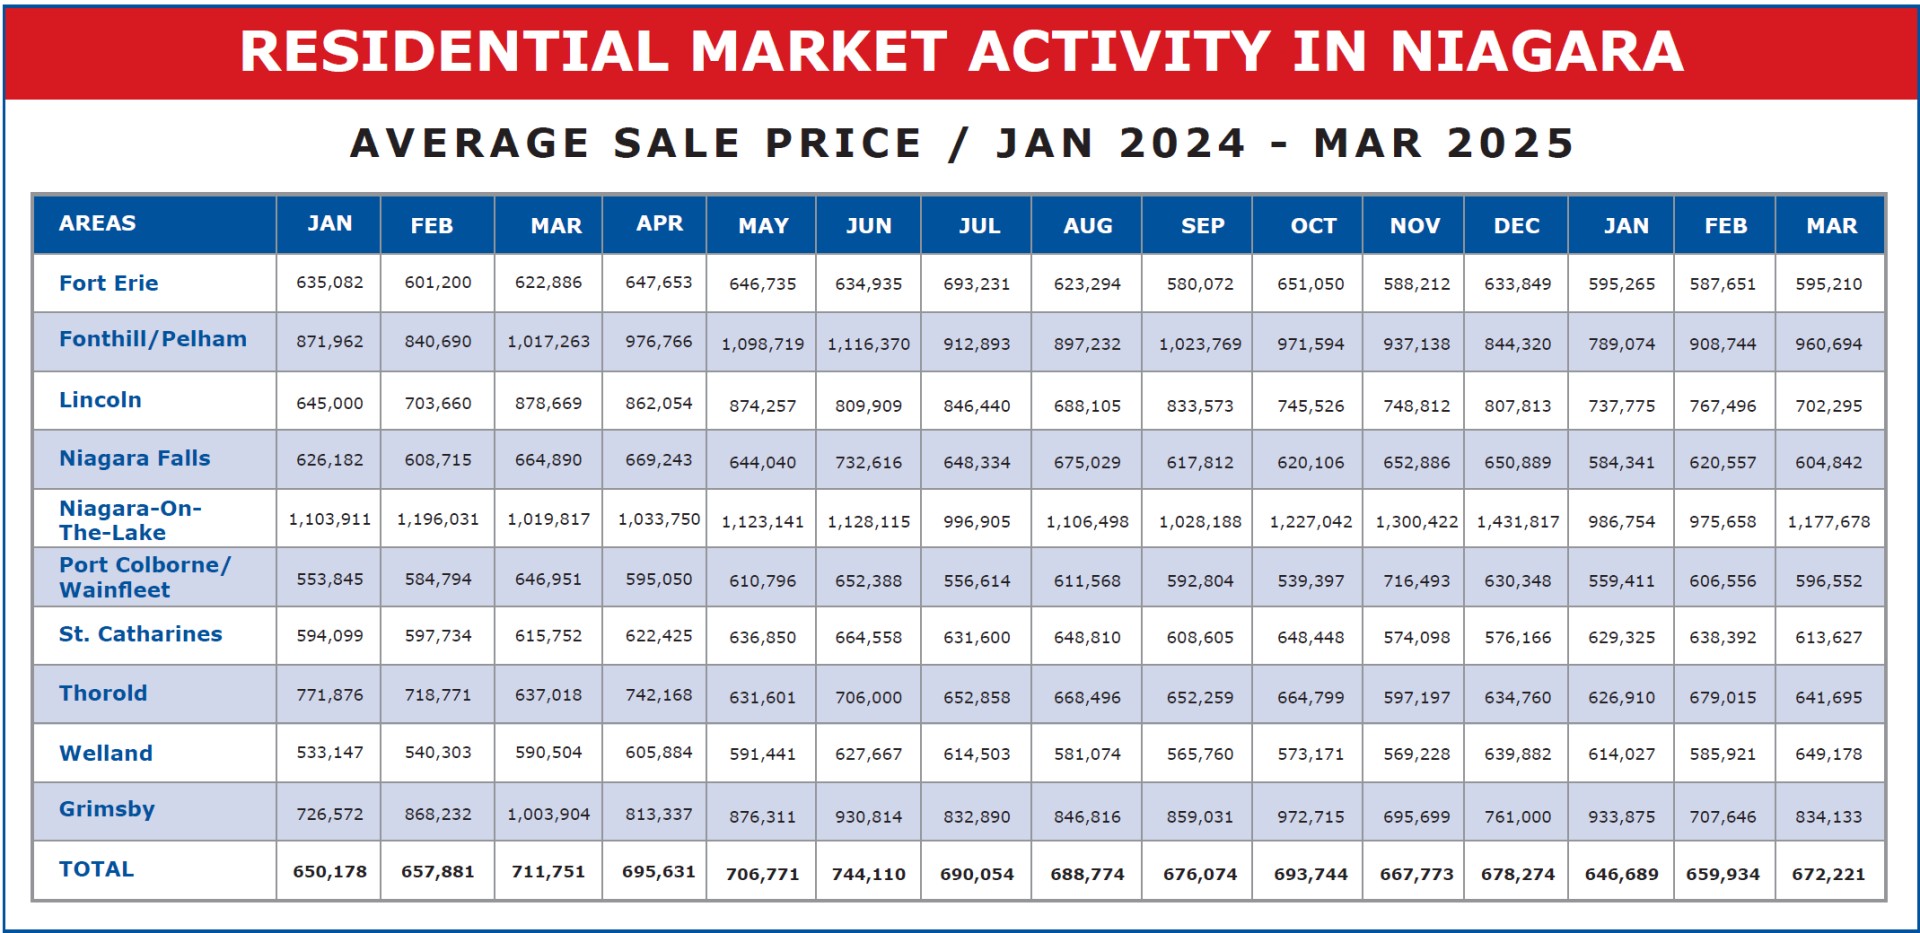
At this point, let’s look at what is happening in prices. Are they falling with the decrease in activity this year, or are they following the spring trend and increasing as well?
As we’ve seen, we took quite a hit in average price from December, 2024 to January 2025. From $678,274 to $646,689. A drop of $31,585 or 4.66%. But this February gained $13,245 over January. An increase of 2.05%. And March came in up another $12,287 from February. A further increase of 1.86%. Certainly not the gain we saw last year, when the average price from January to March grew by $61,573 or 9.47%. But upward trend none the less.
When we put the results on a graph we can see more clearly the upward trend each year over the first three months. One glance and it quickly becomes apparent that the growth is slower and reduced in absolute numbers compared to either 2023 or 2024.
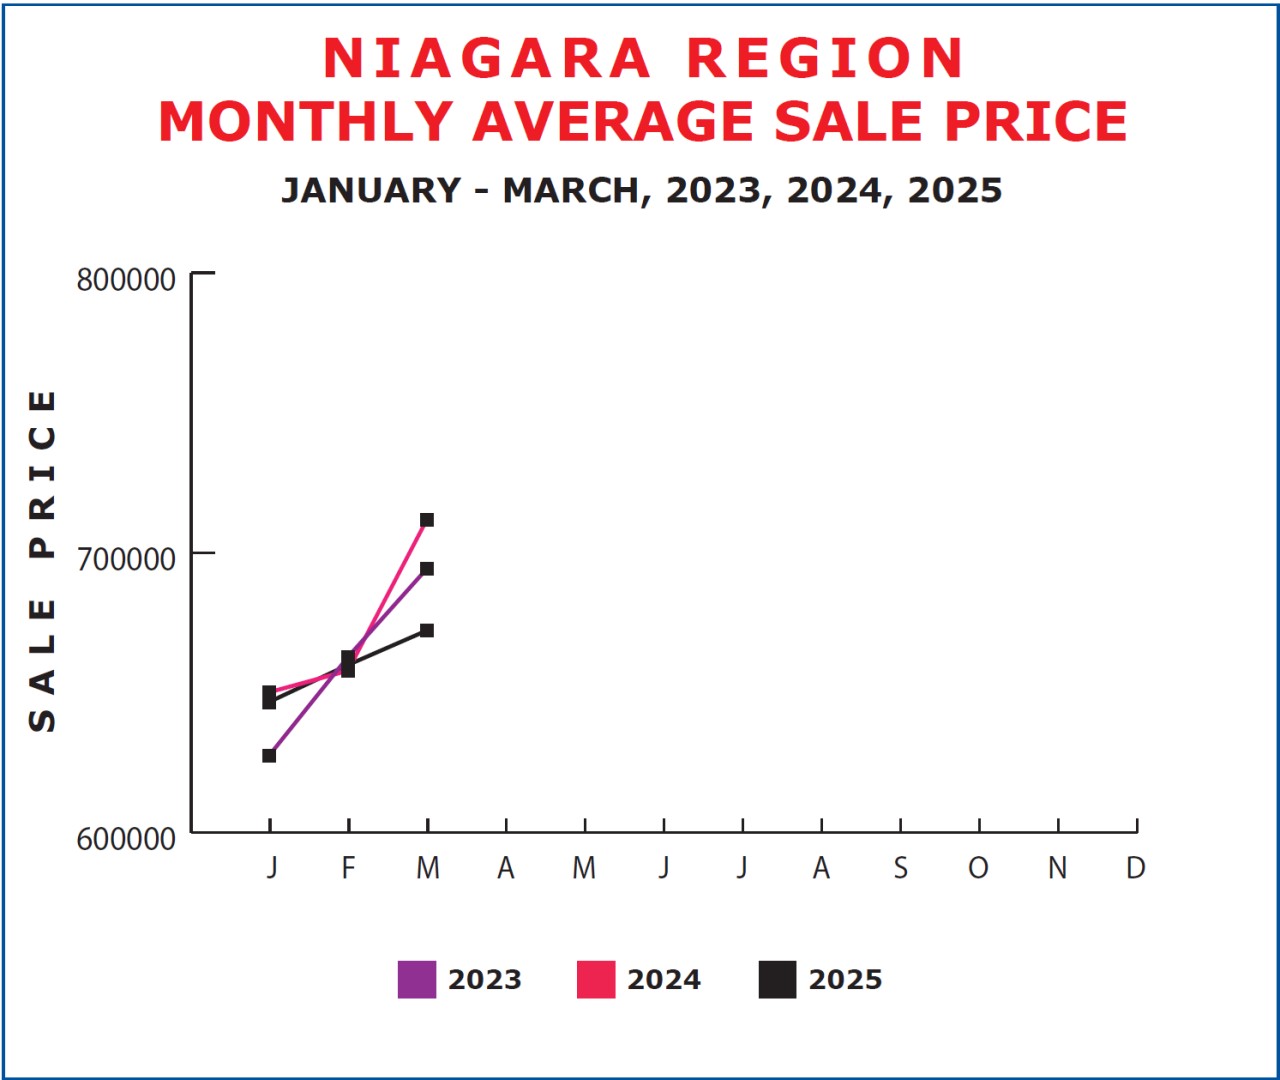
It will be interesting to see what happens to price over the balance of the year. Will we see the trend we have seen in the past of rising prices in the first half of the year, followed by a decline over the last 6 months? Will the numbers climb and begin to close the gap between now and the corresponding months of 2023 and 2024, as the interest rate cuts continue and the political climate stabilizes? Or will the balance of 2025 be lack luster?
In order to better follow the trends over the balance of the year, I’ve included a chart of average prices since the beginning of 2024. It will be interesting to watch.